BOULDER, Colorado — The Front Range of Colorado is closing in on the snowiest part of the winter – which on average is between the middle of February and the middle of April.
The National Weather Service is using some new graphics to help everyone understand the forecast.
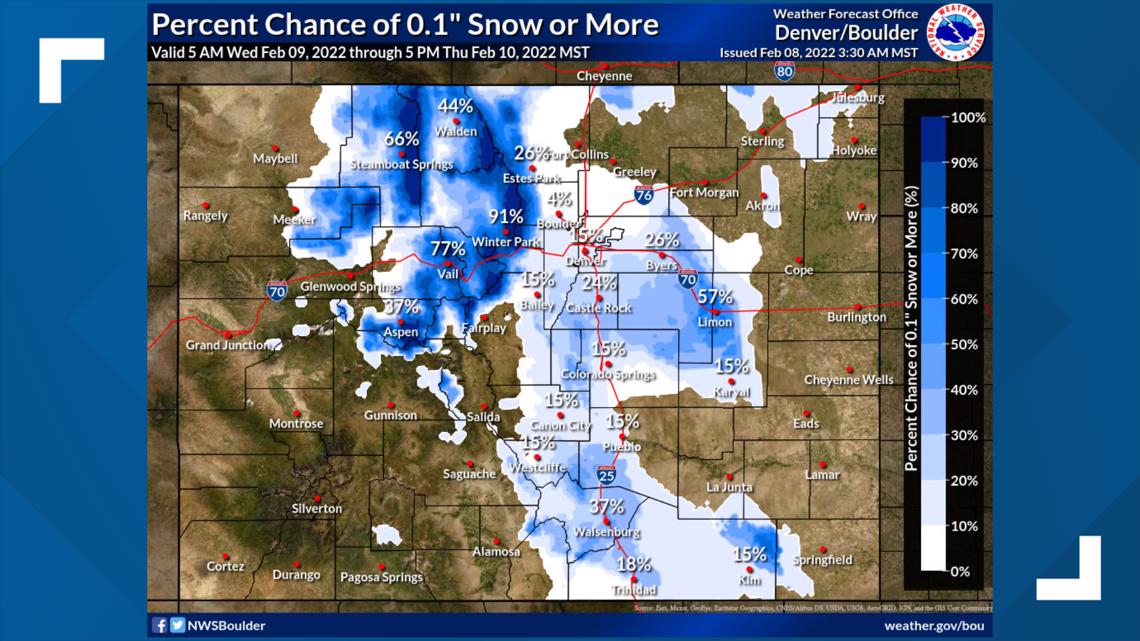
Instead of showing only the expected snow total with the highest probability, or a spread of the two or three most likely totals, they are showing the chances of getting any amount of snow -- from zero to more than 18 inches.
“It seems to get the message out to the public much better in terms of what the real range of snowfall possibilities are instead of just a single snowfall number,” NWS meteorologist Paul Schlatter said.


He said these graphics are not new, but not many people know where to find them because they are still in the experimental phase. That just means they are still taking public input on the products.
The forecast is located in a section of the NWS main page. Each of the four NWS offices that forecast for Colorado has it on their site. The sites also include links to share input about the graphics.
Find the sites:
- BOULDER OFFICE, which serves 22 counties in northeast Colorado.
- PUEBLO OFFICE, which serves most of southeast Colorado.
- GOODLAND OFFICE, which serves three Colorado counties on the Eastern Plains.
- GRAND JUNCTION OFFICE, which serves the Western Slope.
The charts cover more than 100 different locations, and show the probability in map, chart or bar graph format.
Schlatter said the probabilities come from a sophisticated computer algorithm.
“Well over 100 different sources of numerical weather prediction information combines it into one, and generates a spread of values based on those 100-plus forecasts," he said.
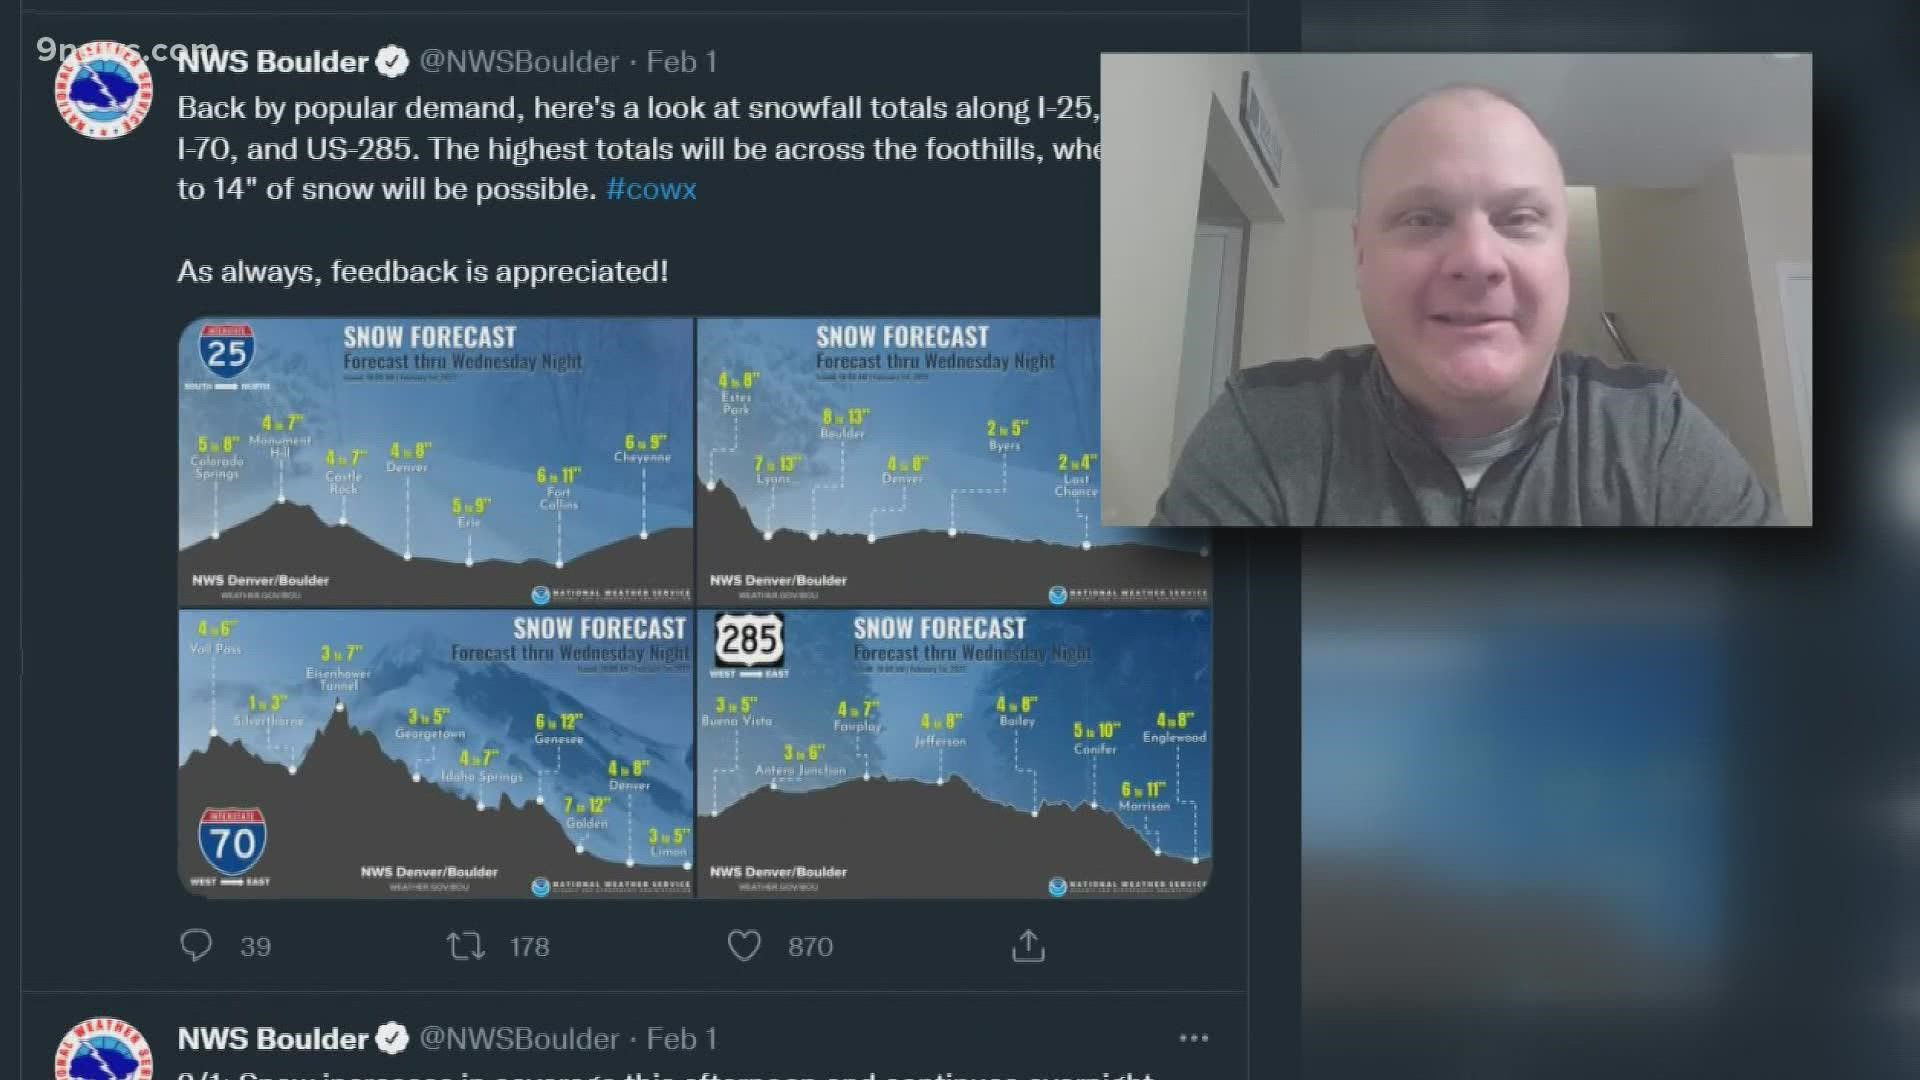
If you prefer to just stick with the highest probabilities, the National Weather Service is trying a new-look graphic on their social media pages. It shows the most likely spread laid out with the Colorado terrain.
Schlatter said these will be used for high-impact storms like the one last week.
“We’ve been very enthusiastic about how much of an impact those graphics have made out in the social media universe," he said.
SUGGESTED VIDEOS: Science & Weather

