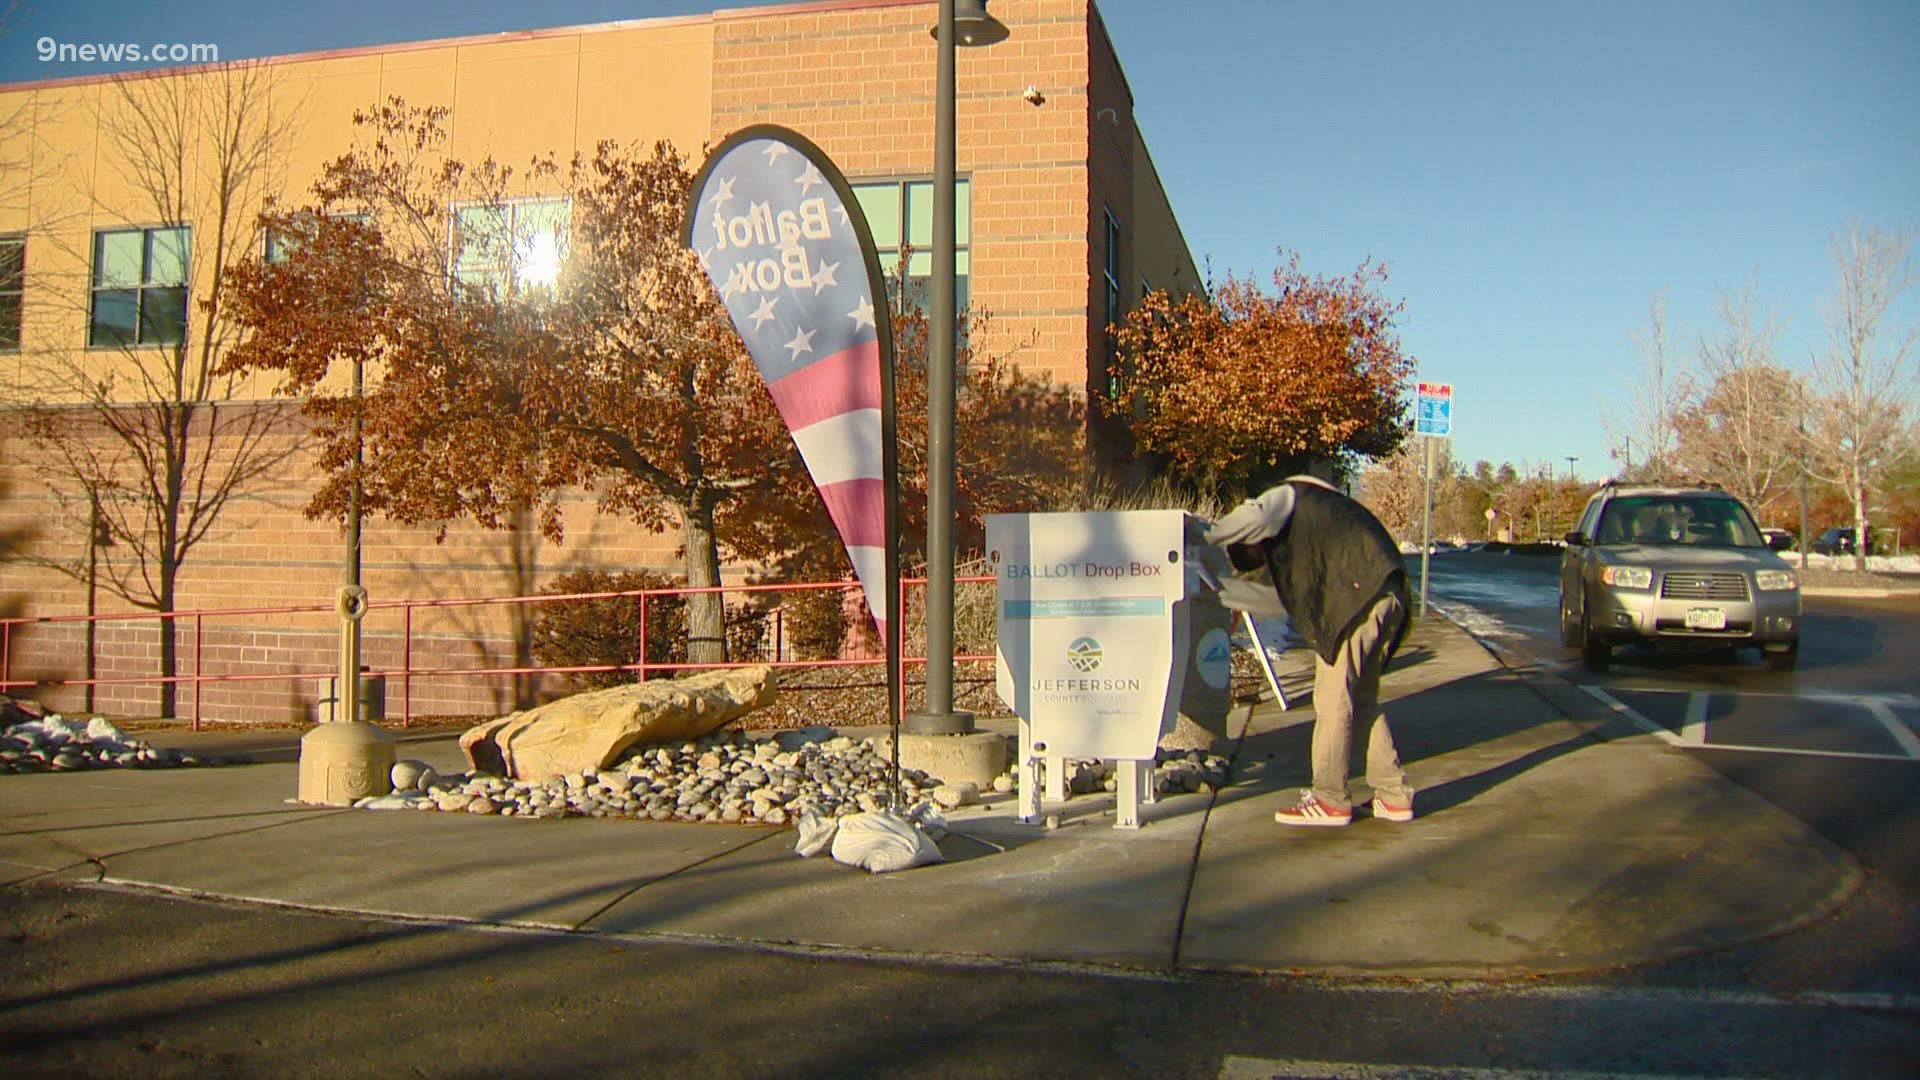
DENVER — The Colorado Secretary of State's Office said on Thursday that 1,565,994 ballots have been returned so far in the Nov. 2 Coordinated Election.
That's 1,546,344 mail ballots, plus 19,650 people who voted in person, according to the Secretary of State's Office.
Those numbers are pretty typical turnout for an odd-year coordinated election, according to historical data. The last two times Colorado held a coordinated election were in 2015 and 2013, when about 1.2 million and 1.4 million ballots were cast.
Here are some statistics on this year's voter turnout so far, courtesy of the Secretary of State's Office on Wednesday.
Turnout by county
The top five counties for numbers of ballots cast this year were:
- Jefferson County: 185,139
- El Paso County: 173,083
- Arapahoe County: 157,322
- Douglas County: 127,068
- Denver City & County: 113,574
Turnout by party
Of the 1.4 million ballots cast this year:
- Democrats: 444,296 (30.77%)
- Republicans: 466,414 (32.3%)
- Unaffiliated: 518,515 (35.91%)
- Libertarian: 10,059 (0.7%)
- Other: 4,787
Turnout by age and gender
Coloradans between the ages of 65 and 74 cast more ballots than any other age group. They were followed by the 55-to-64 and 75-and-over age groups.
As for gender: Slightly more women than men cast ballots among Democrats, Republicans and unaffiliated voters.
The group that ruled voter turnout for age and gender was women ages 65 to 74, with 173,954 ballots cast.
Right behind them were men in the 65-to-74 age group, with 160,294 ballots cast.
Behind them, for ballots returned by age and gender:
- Women, 55-64: 156,540 ballots
- Men, 55-64: 143,135 ballots
- Women 45-54: 110,711 ballots
- Women 75 and older: 109,584 ballots
- Men, 45-54: 108,321 ballots
- Women, 35-44: 101,200 ballots
- Men, 35-44: 94,656 ballots
- Men, 75 and older: 94,536 ballots
- Women, 25-34: 64,975 ballots
- Men, 25-34: 60,734 ballots
- Men, 18-24: no number provided
- Women, 18-24: no number provided
SUGGESTED VIDEOS: Politics

