Want to live five years longer? You might just need to move a block over.
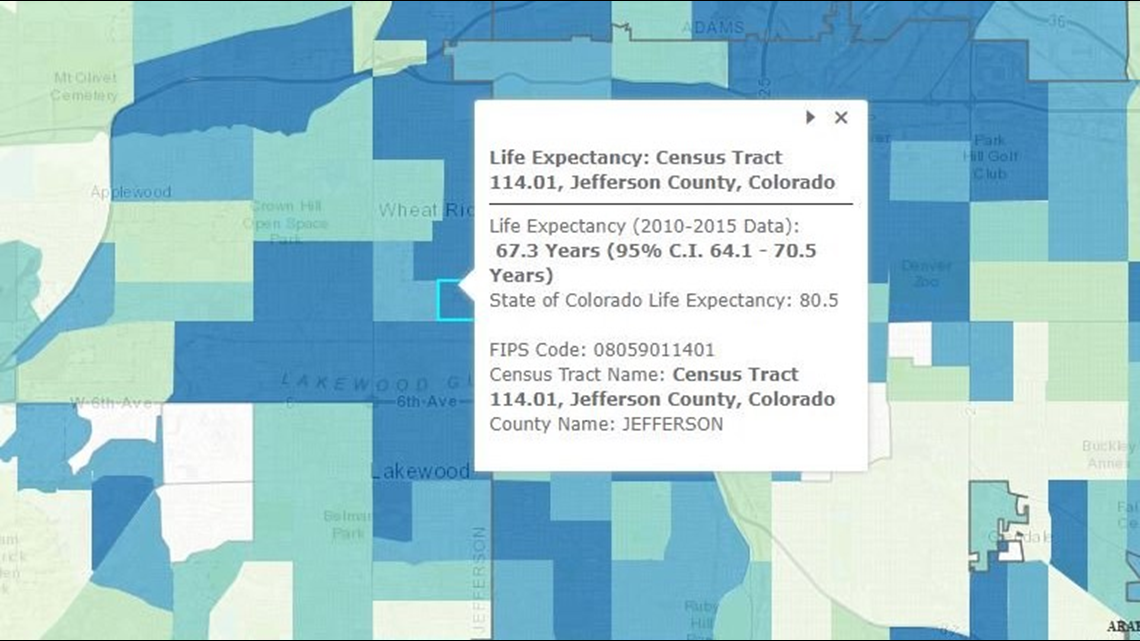
Ok, it’s not that simple, but a new map distributed by the Colorado Department of Public Health and the Environment shows the discrepancies in life expectancy between Coloradans who are just a few blocks apart.
You can find the map here: https://bit.ly/2xc45Yq
The interactive map is broken up into roughly 4,000-person census tracts, and uses death data from 2010 to 2015.
The area with the highest life expectancy, according to map, is actually a part of Garfield County in the far western part of Colorado. People there live an average of 89.4 years – far longer than Colorado’s average of 80.5.
The census tract with the lowest life expectancy was one in Edgewater bounded by West 20th Avenue, Kendall Street, West Colfax Avenue and Sheridan Boulevard. Residents there only lived an average of 67.3 years, according to the data.


That’s nine years less than people just across Sheridan on the other side of Sloan’s Lake, and more than 10 years less than the people on the other side of Kendall Street.
Of course, there’s more to life expectancy than just geography. Income, race and healthcare access all play a role – and that’s why health officials track the data in the first place.
Kirk Bol is one of the people from CDPHE who was involved with the two-year project.
"The key phrase behind it is, health is often driven by the choices we make but choices we make are limited to those that are available to us," Bol said.
He said when residents look at this data, they need to think about the big picture, and that it will start a conversation about mortality rates and making healthy choices.
“Reach out to your community partners and use these tools to hopefully empower and give a voice to even individuals within a community to say somethings not right here," Bol said. "This data isn't useful if it sits in our office and we pour over it ourselves. It's only useful if we can get it into the hands of everybody."


